
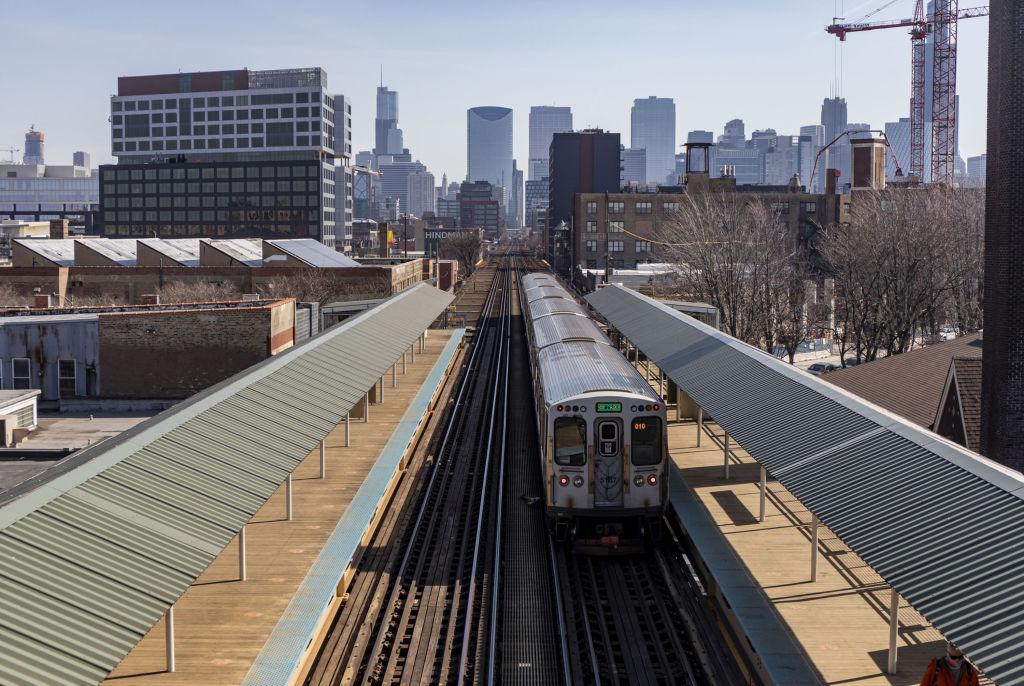
It’s no secret the CTA hasn’t been the most reliable way to get around the last couple years. That’s why we’re looking at how to use the transit agency’s updated dashboard and other tools.
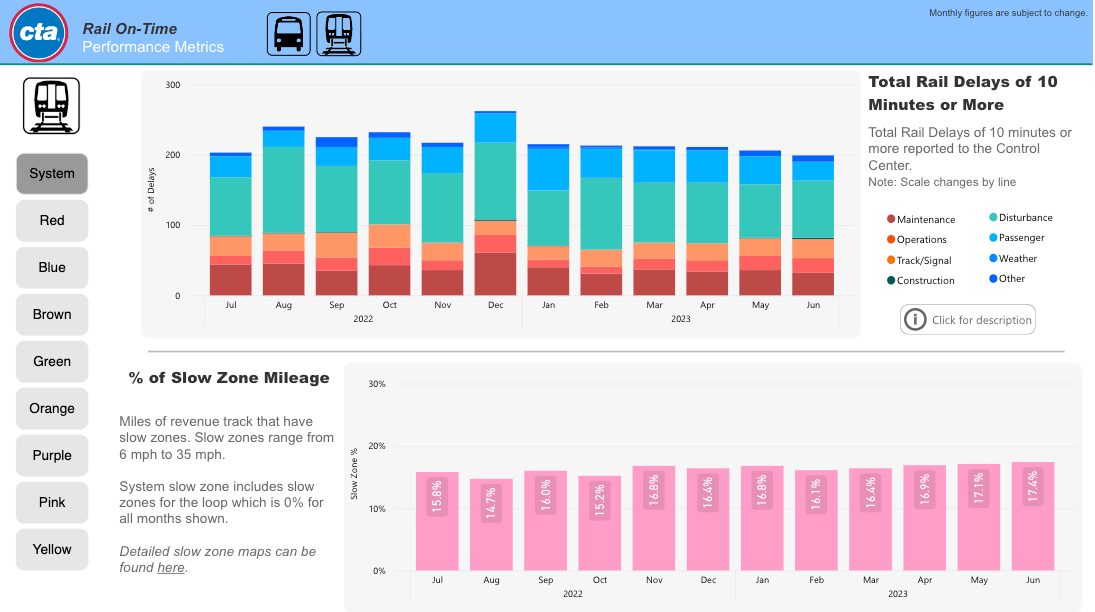
Train delays from July 2022 to June 2023. (Courtesy of CTA)
CTA Key Metrics
Total Ridership
The CTA saw 24.3 million registered rides on buses and trains in May, a 15% increase from the year before but still lower than before COVID. This summer could set new records for post-pandemic ridership, between big concerts like Taylor Swift and Beyoncé as well as NASCAR weekend.
Train Delays
Train delays of 10 minutes or more are similar compared to last summer, peaking in December with more than 250 delays reported. Disturbances, like trespassing and police activity, have been the No. 1 cause of delays this year.
Late Buses
There are fewer big gaps between buses than last summer. Big gaps are defined as double the scheduled time and greater than 15 minutes.
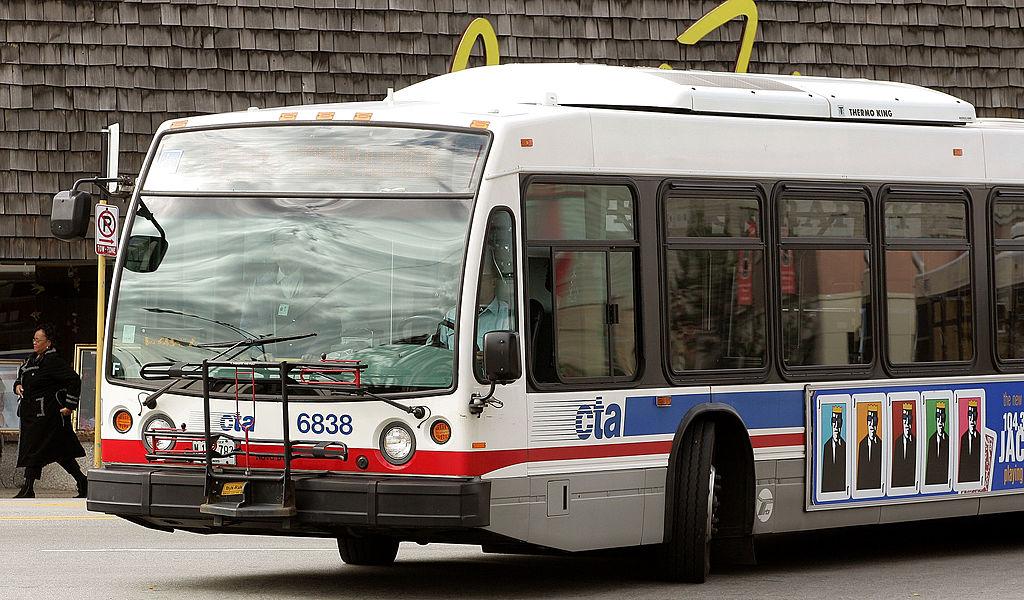
A CTA bus. (Tim Boyle / Getty)
Other Tools
CTA Reliability
Coder Brandon McFadden’s dashboard tracks how often CTA’s scheduled lines and routes are actually running, aka ghost trains and buses.
Commuters Take Action
The group is pushing for improvements to service, transparent hiring, fair working conditions, and an accurate tracker. Want to report a late train or bus? Fill out their forms.